Attractive Statistics
11 out of 10 dentists recommend drinking Coca-Cola before sleep. It has been clinically tested and proven that there are so many chemicals in the drink that no bacteria in your cavity stand a chance of survival.
What is sometimes more valuable than a mountain of data is knowing how to interpret it usefully to solve actual problems. Marketing, for example, is one of those facets of human activity where statistics are commonly thrown about, but data science is far from being just about knowing how to sell stuff to people.
 Image source: Stanford

For the last couple of months, my main area of interest has been EdTech. It all started with me wanting to help high school students who struggle with math, a need I noticed firsthand through my own tutoring experience. One of the services I have been intensively working on is MAMUT, a web service focused on providing all the necessary information for passing the standardized Czech high school leaving exam, most commonly referred to as Maturita.
Realizing the Data Exists
As I was rummaging through Maturita-related websites on the Czech internet, it suddenly occurred to me that there is no Maturita solution website—at least that I know of—that makes efficient use of examination results.
Admittedly, a few individuals have tried making summary diagrams and infographics on how students are becoming worse at taking Maturita each year.1 However, that doesn’t shed light on what actually makes Maturita difficult for students. CERMAT, the exam body responsible for administering and evaluating the Maturita exam, periodically publishes detailed exam results, with granularity down to individual exercises for every single person taking the test.2
 Machine-processable test evaluations provide powerful ammunition for targeting the most common student errors. Image source: Picryl
For me, as someone wanting to alleviate the pressure and stress that certainly comes with the leaving exam, CERMAT datasets feel like a gold mine just waiting to be extracted. This is especially true in the age of language models, which are arguably better at drilling through machine-semireadable text documents than we humans will ever be.
Just because something is possible does not imply the necessity and utility of doing it.
It might as well be the case that we need an a priori diagnosis rather than an a posteriori one, but I refused to settle for eh, whatever ¯\_(ツ)_/¯ as an answer.
Framing the Data
I would like to elaborate on how we might present exam statistics in EdTech in a way that does not rely solely on throwing failure percentages around, accompanied by “interactive” pie charts, just to leave the reader—in this case, a student or an educator—empty-handed.3 I will discuss this approach from three different perspectives.
1. Turn Negativism into Opportunity, Highlight Positives
Psychologically speaking, 80% of students failed to answer this test question is anything but helpful. This just tells the student that they are very likely to suck at this as well. However, this information is still a valuable pedagogical opportunity to explain the exercise in more detail and, in the case of MAMUT, annotate it at the beginning of the solution:
This exercise was quite tricky for students. That’s why we take extra steps so you get it right in your exam.
Also, we often tend to focus on what went wrong in a test, instead of treating the results holistically, including which parts are very likely to be easy and not technically involved. If, for example, you decide to tackle the easiest exercises from the beginning, that gives you more time for the more complicated stuff.
During my tutoring practice, I have noticed students very often making the same mistake of dwelling on a specific problem because they solve everything sequentially, instead of scanning what they are dealing with first. Annotating existing exams by real (exam stats) vs. designed (number of points per exercise) difficulty might serve exactly this purpose.
I would even go so far as to say that 80% of students answered this test correctly isn’t helpful, either. For more anxious students, this might easily translate to yeah, so I’m going to be in the remaining 20 percent. By using a five-step difficulty meter that roughly corresponds to a natural frequency4, we are painting a much simpler and more digestible picture.
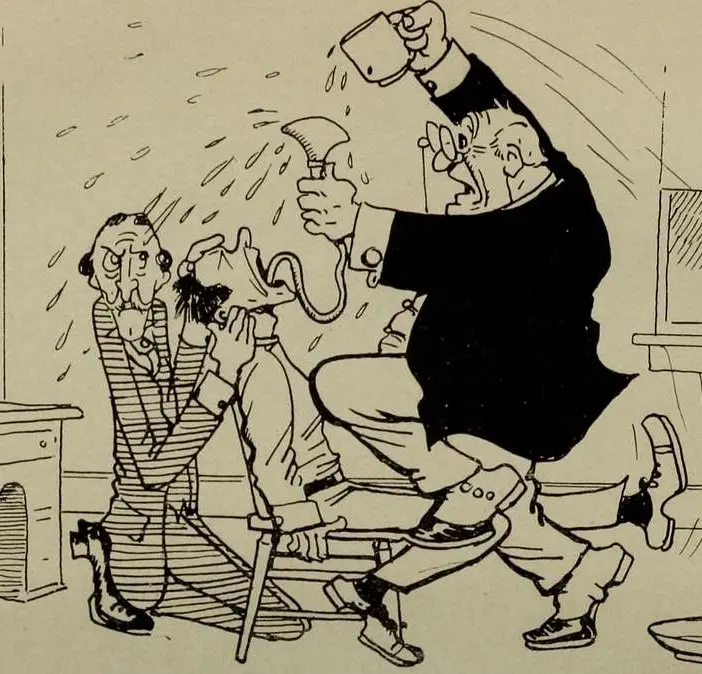 Forcing statistics down someone’s throat without a story rarely works. Image source: Picryl
It is much easier to plan your Maturita prep by starting with green problems first, then working your way through red ones, rather than solving exercises labeled with a 20-percent chance of success, even though they come from the exact same information base.
2. Process of Elimination in Practice
Excluding nonsensical answers and then making a guess from the remainder is better than leaving an answer blank, since Maturita doesn’t penalize wrong answers. Again, CERMAT datasets can be immensely helpful here: if a given exercise was left unanswered by a large volume of students, it points directly to a difficult or confusing problem that needs more pedagogical attention.
One way or another, many people might consider guessing dishonorable; some might consider it applying the rules of probability in practice. My intention isn’t to justify cheating—which guessing never is, anyway. It’s more about using what the student is allowed to do for their best benefit, but using it in the smartest way possible.
Once MAMUT starts interconnecting different sessions by categorizing every exercise, I predict these insights will get even more interesting.
3. Personalization with No Surprises
67% of students passed the exam on the first take. Get it, six seven? ;)
Silly antics and cringe jokes are definitely not something that would make MAMUT trustworthy. Heuri, the overarching platform which MAMUT is a part of, is brutalist by design.5 CERMAT also organizes the examination result datasets by school types (general, agriculture, arts, health care, etc.), so if the user fills in what school they are from, we can provide them with data that are more relevant to them, rather than to the average high schooler.6
This leads me to a more general conclusion: MAMUT should be community-driven more than data-driven. The statistics should give us a good ballpark of topics to start from, but that doesn’t mean we should stop there. In the words of a classic: we can hardly come of age through a coming-of-age exam. In its current form, Maturita is merely a necessary evil that we should help students overcome efficiently.
Happy learning!
-
Personally, I think this has less to do with the cognitive deterioration of the students than we are willing to admit. It is just that we make the examination so arbitrary and hostile in itself that many people simply cannot bear the pressure, regardless of their actual competences. ↩︎
-
The CERMAT Excel spreadsheets are anonymized, of course. ↩︎
-
One important thing to note here: MAMUT is designed to be a last-minute first-aid kit, not a long-term sustainable way of approaching learning. I am designing this specific service to be accessible in the broadest sense of the word. If you are taking Maturita next week, you don’t have time to watch hour-long videos of enthusiastic teachers or tutors showing you how it’s done. MAMUT aims to get you through the exam, not show you how to discover utility in mathematics; the damage has been done and it’s too late for that. ↩︎
-
Natural frequency in this case would be 4 out of 5 students instead of using percentages. ↩︎
-
I touched on what brutalism means to Heuri in a previous article. ↩︎
-
From my experience, the different kinds of math taught at different types of schools lead to different ways of problem solving. For example, students from technical schools tend to be more competent and confident at geometry. ↩︎