5. Geoapify Client Integration Part One - Proof of Concept, Pandas Table Model
Now that we have an UI and are able to respond to user actions, it is now the time to integrate our Geoapify client into the plugin code.
The Geoapify client consists of one simple method:
1
2
3
4
5
6
7
8
9
10

def search(query: str, api_key: str, lang: str = "en") -> GeoDataFrame:
    return GeoDataFrame.from_features(
        Client(api_key=api_key).geocode(
            text=query,
            parameters={'lang': lang}
        ),
        crs=GEOAPIFY_CRS
    )
This is the output we get for a prompt Abbey Road, London, United Kingdom:
1
2
3
4
5
6
7
8
9
10
11
12
13
14
15
16
17
18
19
20
21
22
23
24
25
26
27
28
29
30
31
32
33
34
35
36
37
38
39
40
41
42
43
44
45
46
47
48
49
50
51
52
53
54
55
56
57
58
59
60
61
62
63
64
65

{
  "type": "FeatureCollection",
  "features": [
    {
      "id": "0",
      "type": "Feature",
      "properties": {
        "datasource": {
          "sourcename": "openstreetmap",
          "attribution": "© OpenStreetMap contributors",
          "license": "Open Database License",
          "url": "https://www.openstreetmap.org/copyright"
        },
        "name": "Abbey Road",
        "ref": "A123",
        "country": "United Kingdom",
        "country_code": "gb",
        "state": "England",
        "county": "Greater London",
        "city": "London",
        "postcode": "IG11 7EP",
        "district": "London Borough of Barking and Dagenham",
        "neighbourhood": "Roding Riverside",
        "street": "Abbey Road",
        "lon": 0.0736776,
        "lat": 51.5374693,
        "state_code": "ENG",
        "result_type": "street",
        "formatted": "Abbey Road, London, IG11 7EP, United Kingdom",
        "address_line1": "Abbey Road",
        "address_line2": "London, IG11 7EP, United Kingdom",
        "timezone": {
          "name": "Europe/London",
          "offset_STD": "+00:00",
          "offset_STD_seconds": 0,
          "offset_DST": "+01:00",
          "offset_DST_seconds": 3600,
          "abbreviation_STD": "GMT",
          "abbreviation_DST": "BST"
        },
        "plus_code": "9F32G3PF+XF",
        "plus_code_short": "G3PF+XF London, Greater London, United Kingdom",
        "rank": {
          "importance": 0.41001,
          "popularity": 7.838684191955424,
          "confidence": 1,
          "confidence_city_level": 1,
          "confidence_street_level": 1,
          "match_type": "full_match"
        },
        "place_id": "5107a1720289dcb23f59500d45cbcbc44940f00102f901e00ee...",
        "suburb": null
      },
      "geometry": {
        "type": "Point",
        "coordinates": [
          0.0736776,
          51.5374693
        ]
      }
    }
  ]
}
This is actually only the first result provided by Geoapify but it sufficiently demonstrates the capabilities of the Geocoding API. We can see that all data which we will display in the plugin table view are ready for us in this response.
We now need to call the search method whenever user clicks the search button.
This is the PyQT button slot we created before:
1
2
3
4
5
6
7
8
9

def __handleSearchButtonClick(self):
    address = self.addressLineEdit.text()
    api_key = self.apiKeyLineEdit.text()
    self.iface.messageBar().pushMessage("Test",
                                        f"Testing the plugin: address {address}, api_key {api_key}",
                                        level=Qgis.Info,
                                        duration=3)
Let’s call search and display the contents to the Log Messages Panel:
1
2
3
4
5
6
7
8
9
10
11

def __handleSearchButtonClick(self):
    address = self.addressLineEdit.text()
    api_key = self.apiKeyLineEdit.text()

    geoframe = search(api_key=api_key, query=address)
    QgsMessageLog.logMessage(
        message=str(normalizeGeoDataFrame(original_df=geoframe)),
        level=Qgis.Info
    )
Sidenote: the normalizeGeoDataFrame is an auxiliary function which makes sure that if any column of our table is not present (e.g. The Tower of London does not have a street associated to it), we will fall back to None:
1
2
3
4
5
6
7
8
9
10
11

def normalizeGeoDataFrame(original_df: GeoDataFrame, columns: List[str] = None) -> GeoDataFrame:
    if columns is None:
        columns = ['name', 'street', 'city']
    return GeoDataFrame(
        data=original_df,
        geometry=original_df.geometry,
        crs=original_df.crs,
        columns=columns
    ).replace(numpy.nan, None)
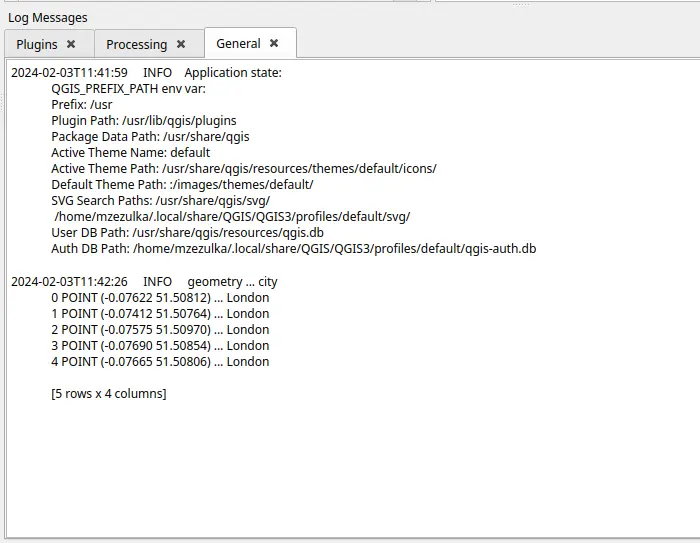
The Log Messages Panel is very useful when you’re debugging your code but you might as well keep these helper logs even after you’re done with the real implementation. In case anything goes wrong, you at least show the user what went wrong.

QgsMessageLog.logMessage in action once user clicked the “search” button in the plugin.
Now, we need to display our results to the user. The most straightforward way would be to populate the plugin table view manually like this:
1
2
3
4
5
6
7
8
9
10
11
12
13
14
15
16
17
18
19
20
21
22
23
24
25
26
27
28
29
30
31
32
33
34
35
36
37
38

def __handleSearchButtonClick(self):
    ...
    geoframe_with_defaults = normalizeGeoDataFrame(original_df=geoframe)
    ...

    self.__populateResultTableWidget(df=geoframe_with_defaults)

def __populateResultTableWidget(self, df: GeoDataFrame):
    QgsMessageLog.logMessage(
        message="Putting the dataframe into resultTableWidget...",
        level=Qgis.Info
    )
    [
        # make space for the new row
        self.resultTableWidget.insertRow(row)
        for row in df.index
    ]
    [
        # insert data at the bottom
        self.resultTableWidget.setItem(
            row,
            c_ix,
            QTableWidgetItem(
                self.__dfValue(
                    column=col,
                    row=row,
                    df=df
                )
            )
        )
        for row in df.index
        for c_ix, col in enumerate(["name", "street", "city"])
    ]

def __dfValue(self, column: int, row: int, df: GeoDataFrame):
    return str(df[column][row]) if not df.isna(df[column][row]) else None
and this approach is perfectly fine, but the Model/View architecture available in QT is a more cleaner and flexible way of connecting our Pandas dataframe to the QT table widget. If you’re not sure how the Model/View architecture works, I highly recommend reading the QT documentation which will get you right on track.
The most basic implementation of a Geopandas table model can look something like this:
1
2
3
4
5
6
7
8
9
10
11
12
13
14
15
16
17
18
19
20
21
22
23
24
25
26

class GeopandasModel(QtCore.QAbstractTableModel):
    def __init__(self, data: GeoDataFrame, parent=None):
        QtCore.QAbstractTableModel.__init__(self, parent)
        self._data = data

    def rowCount(self, parent=None, *args, **kwargs):
        return len(self._data.values)

    def columnCount(self, parent=None, *args, **kwargs):
        # take away the geometry column
        return self._data.columns.size - 1

    def data(self, index: QModelIndex, role=QtCore.Qt.DisplayRole):
        if index.isValid() and role == QtCore.Qt.DisplayRole:
            index_val = self._data.iat[index.row(), index.column()]
            return str(index_val) if index_val else None
        else:
            return None

    def headerData(self, col: int, orientation: Qt.Orientation, role=None):
        if orientation == QtCore.Qt.Horizontal and role == QtCore.Qt.DisplayRole:
            return self._data.columns[col]
        else:
            return None
We then link this model to our table view in the dock widget:
1
2
3
4
5
6
7
8

def __handleSearchButtonClick(self):
    ...
    geoframe_with_defaults = normalizeGeoDataFrame(original_df=geoframe)
    ...

    self.resultTableView.setModel(PandasModel(data=geoframe_with_defaults))
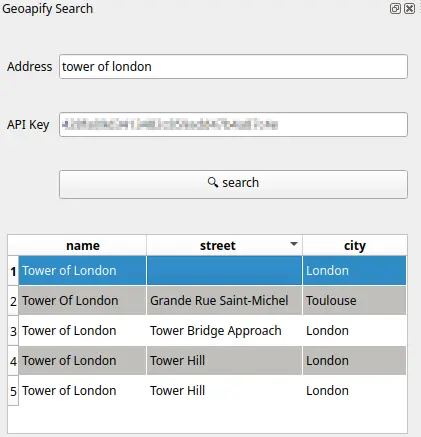
Et voilà, this is what is displayed in the table once we click the search button:
Notice that QT has a straightforward graphical interpretation of None, or “the missing value”, if you prefer. Besides that, the QT framework also knows out of the box how to sort columns with such data. Neat!
Here be dragons: as of writing this article, it seems that Geopandas isn’t that much friends with QGIS as importing this module results in a QGIS crash1. The recommended way is to rather use PyQGIS. PyQGIS is IMHO very cumbersome to use but on the other hand, if you’re planning on distributing your plugin to many users, staying away from Geopandas might save you a lot of headaches. I’ve decided to leave Geopandas in this tutorial because the chances are that you have existing scripts and codebase in (Geo)Pandas already. If you really insist on using Geopandas, the trick is to override the PYTHONPATH environment variable in QGIS so that it points to your global pip packages.
You could think that we’re almost done with our plugin; the only thing left is to create a QGIS point vector layer which will contain data from Geoapify.
We’re far from done!
There are already a few problems with the implementation:
- user input is not validated,
- Geoapify client exceptions are not handled gracefully,
- search is executed in the QT GUI thread,
- there are no tests!
We will continue with our implementation in the next part.
